Two methods of bias correction of the climate scenario data were tested in this phase: univariate quantile delta mapping method (QDM) and multivariate bias correction by N-dimensional probability density (MBCn).
QDM is an efficient method which uses a transfer function that transforms the cumulative distribution of the scenario data to match the distribution of the observed series. The obtained transfer function is then applied to historical and projected climate model data. Consequently, the systematic distributional biases relative to historical observations are corrected and the model projected relative changes are preserved (Cannon et al. 2015).
Following an algorithm proposed by (Pitié et al. 2007), this MBCn method is adapting the N-dimensional probability density function as a tool for multivariate bias-correction. The basic idea relates to applying an orthogonal rotation for observed historical simulations; correct the marginal distribution for the rotated data using empirical quantile mapping; apply the inverse rotation to the resulting data. (Cannon 2018). The whole process is repeated until the multivariate distribution from the source data matches the one resulted in the process, therefore reaching the convergence process. Still, the quantile mapping applied to projected simulations can be outside of the historical simulations, therefore affecting the climate signal. In this case, a modified quantile mapping that preserves the original signal is used, this procedure is called quantile delta mapping (Cannon 2018).
In order to adjust the data from the selected Eurocordex models, the functions implemented in the R MBC library were used. The calibration of the two methods was performed with the daily ROCADA data of temperature (average, minimum and maximum) and precipitation, extracted for the period 1971 - 2005. By comparing the adjusted data with the observations (ROCADA datasets), the results of the two bias-corrected (BC) methods were evaluated.
The statistical properties of the two data sets (observed and modelled adjusted) were verified for both parameters with the help of the boxplot diagrams.
It can be noticed that regardless of the climate scenario analysed, in the case of temperature data both BC methods obtain almost similar results, noting that the multivariate method (MBCn) manages to better correct the extreme negative values (e.g. January and February from the ICHEC-EC-EARTH_KNMI-RACMO22E) (Figure 1). Considering the slightly better results of the multivariate method, but also its advantage to maintain the dependence between the analysed variables, it was decided to adjust the temperature data with the MBCn method.
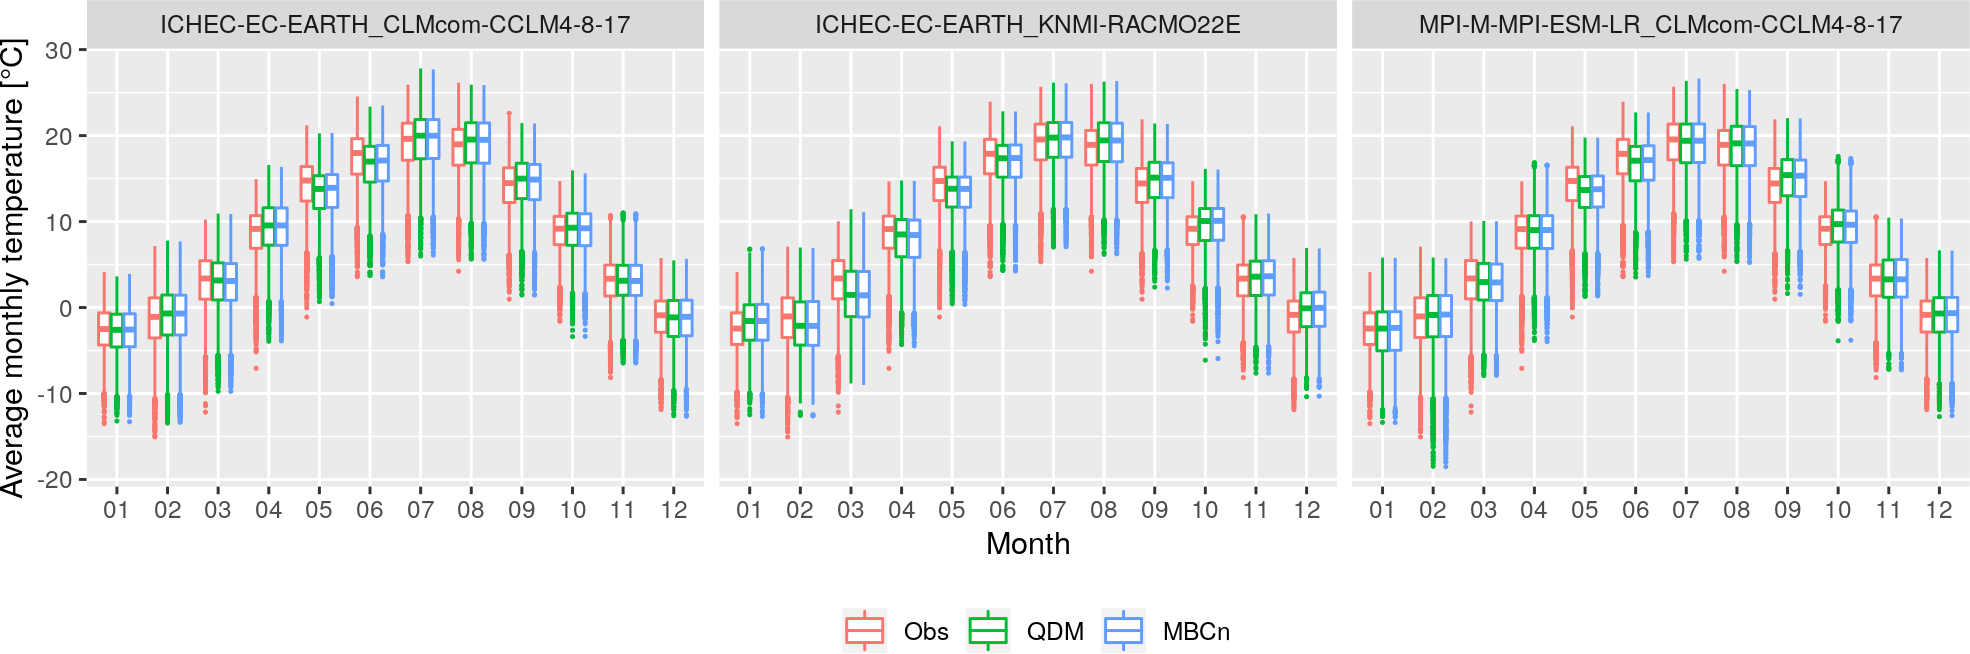 Figure 1 Boxplots of the observed and bias-corrected data: mean monthly air temperature (1971 - 2005).
The box-plot analysis of the precipitation data revealed an obvious difference between the two methods, the MBCn method managing to better approximate the statistical properties of the observed data (Figure 2). Therefore, it was decided in the case of precipitation data to use the MBCn method in the adjustment of climate scenarios.
 Figure 2 Boxplots of the observed and bias-corrected data: monthly precipitation amounts (1971 - 2005.
References:
Cannon, A. J., Sobie, S. R., și Murdock, T. Q. (2015). Bias correction of GCM precipitation by quantile mapping: How well do methods preserve changes in quantiles and extremes?Journal of Climate, 28(17), 6938-6959.
Cannon, A.J., (2016). Multivariate bias correction of climate model output: Matching marginal distributions and inter-variable dependence structure. Journal of Climate, 29:7045-7064.
Cannon, A. J. (2018). Multivariate quantile mapping bias correction: an N-dimensional probability density function transform for climate model simulations of multiple variables. Climate dynamics, 50(1-2), 31-49.
Pitié, François, Anil C. Kokaram, and Rozenn Dahyot. "Automated colour grading using colour distribution transfer." Computer Vision and Image Understanding 107.1-2 (2007): 123-137.